When it comes to adapting new products and practices for our operations, we all have a little Missouri in us . . . . ‘Show Me’. We all want to understand how something woks on our ground and in our productions system. Establishing an on-farm-testing protocol is a common way to evaluate products and practices. But too often, we sit down to evaluate the results in the fall and see that data doesn’t allow us to draw conclusions. Now is the right time to develop a testing plan that increases the odds of success.
The key component to a good test is to isolate the variable you are trying to measure. We have to have a ‘static’ environment for all treatments except for the variable we are measuring. There are a lot of variables in biological systems and even within a small area of a field. Those small differences can make significant differences in the quality of the data. Differences in soil type, elevation, slope, drainage, compaction, residue amount and plant stand are just a few variables you must consider as you pick the location in your field that you will have different treatments. After you identify the most homogenous field environment, the second critical step is to plan multiple replications of the treatments. Three two five replications help to reduce the impact of a weed outbreak, hail, wind or other isolated events that could impact a single location.
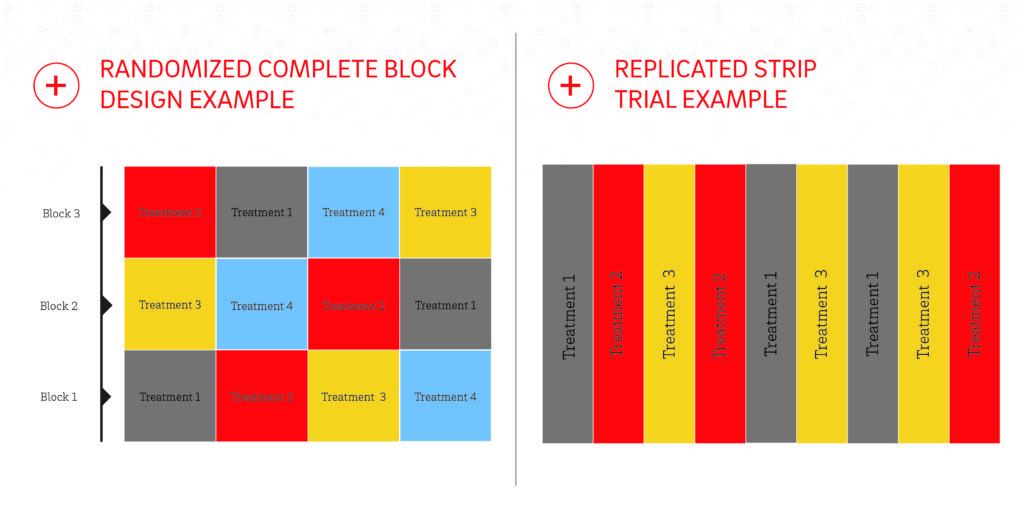
Many university and corporate researchers use a small plot protocol with a Randomized Complete Block design. This allows for maximum repetition in a small, homogenous area. But, this work is often done by hand or with small, specialized plot equipment. With commercial-sized equipment, strip plots are likely the best approach for testing things like hybrids, starter, fungicide or other inputs applied with the planter or sprayer.
Strip plots succeed when there is attention to detail. While modern monitors make it easy to drop a pin and locate the strips, those strips have to match up with header widths and weigh cart capacity in order to really measure response. Yield mapping tools now allow us to select and compare small parts of the field in order to isolate performance of our strips. While these make it easier to track, it still takes diligence throughout the season to ensure that we trust the data that drive our decisions.
Most test strip programs begin with high energy and high hopes. By fall, the urgency to get crops in the bin often mean that test strips get blended or lost. I recommend that you identify a ‘test-strip zar’ to take ownership of the plots and protect them throughout the season. In 2015, 360 Yield Center managed over 80 test locations and 500 treatments to evaluate the impact of mid-season nitrogen timing and placement. The diagram shown here is one we use as a base for many of our trials.
We are excited by the results we saw in 2015 and want to get multi-year data. And now is the time to get these tests in place.